Description
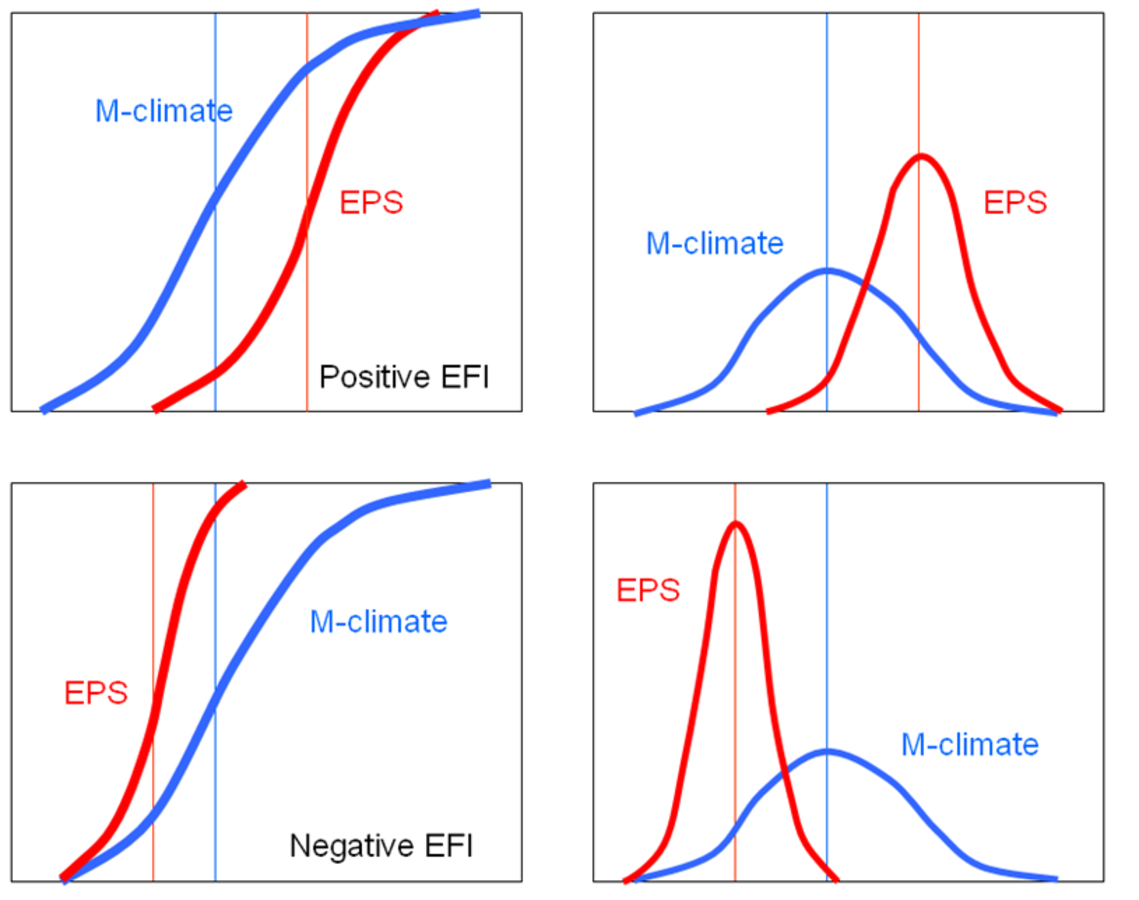
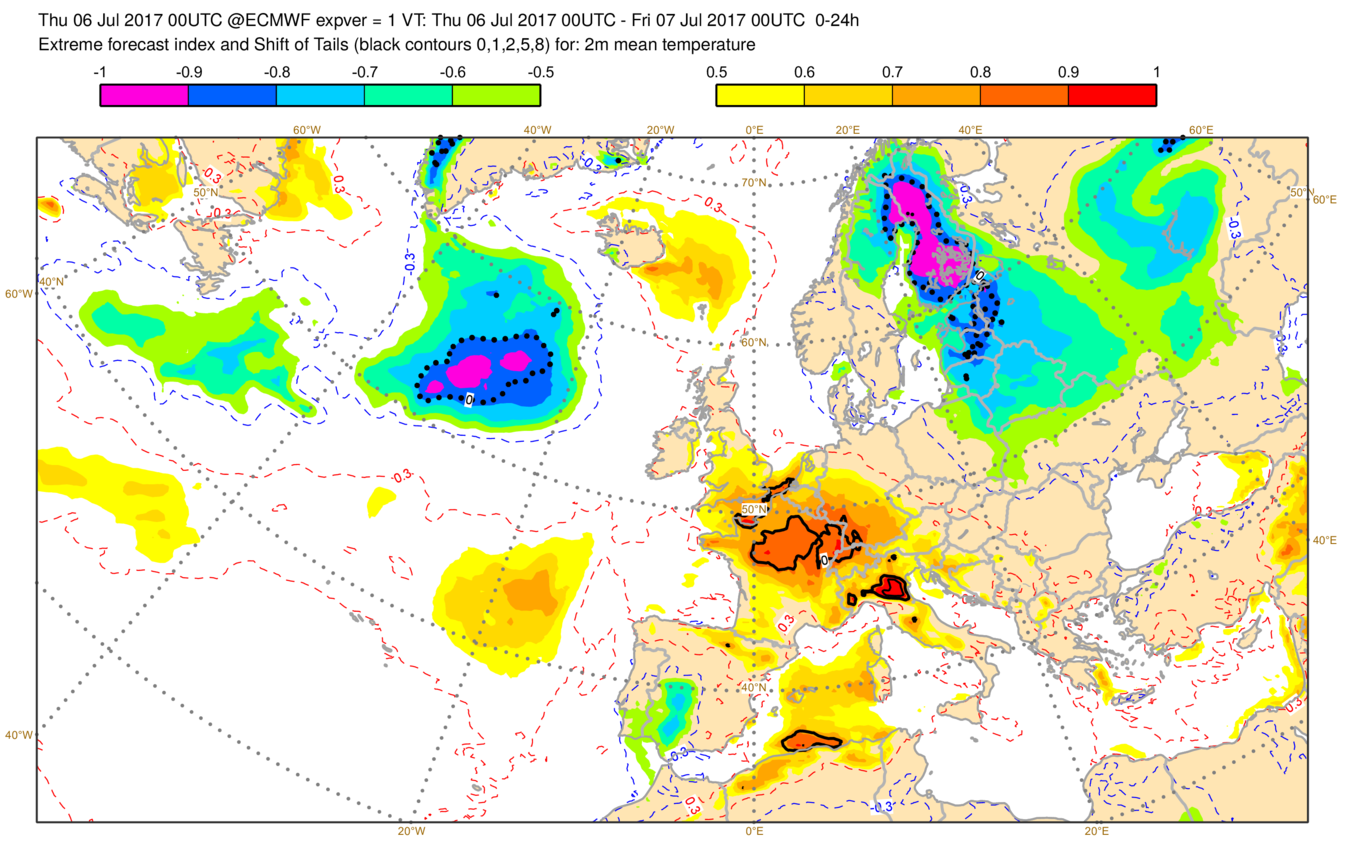
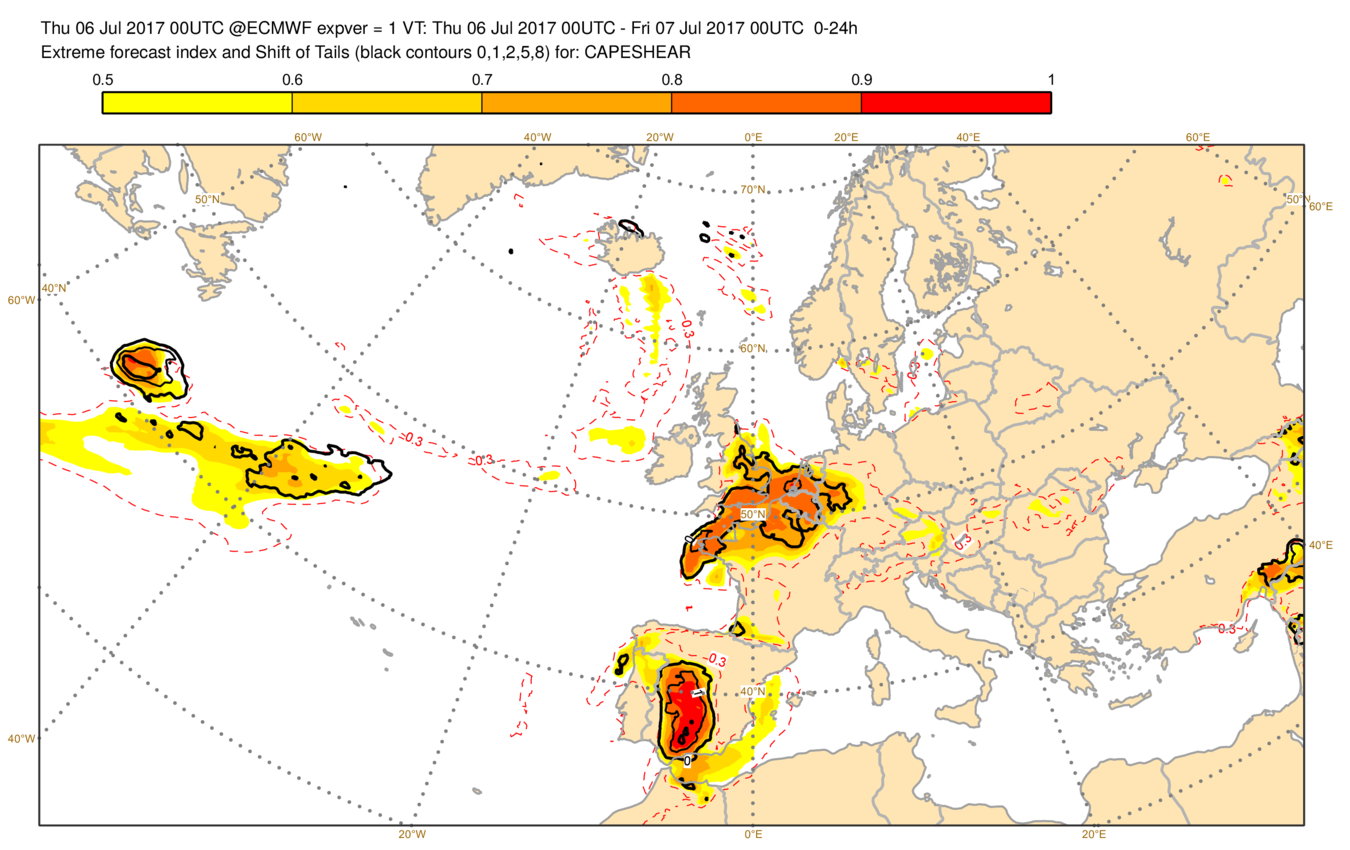
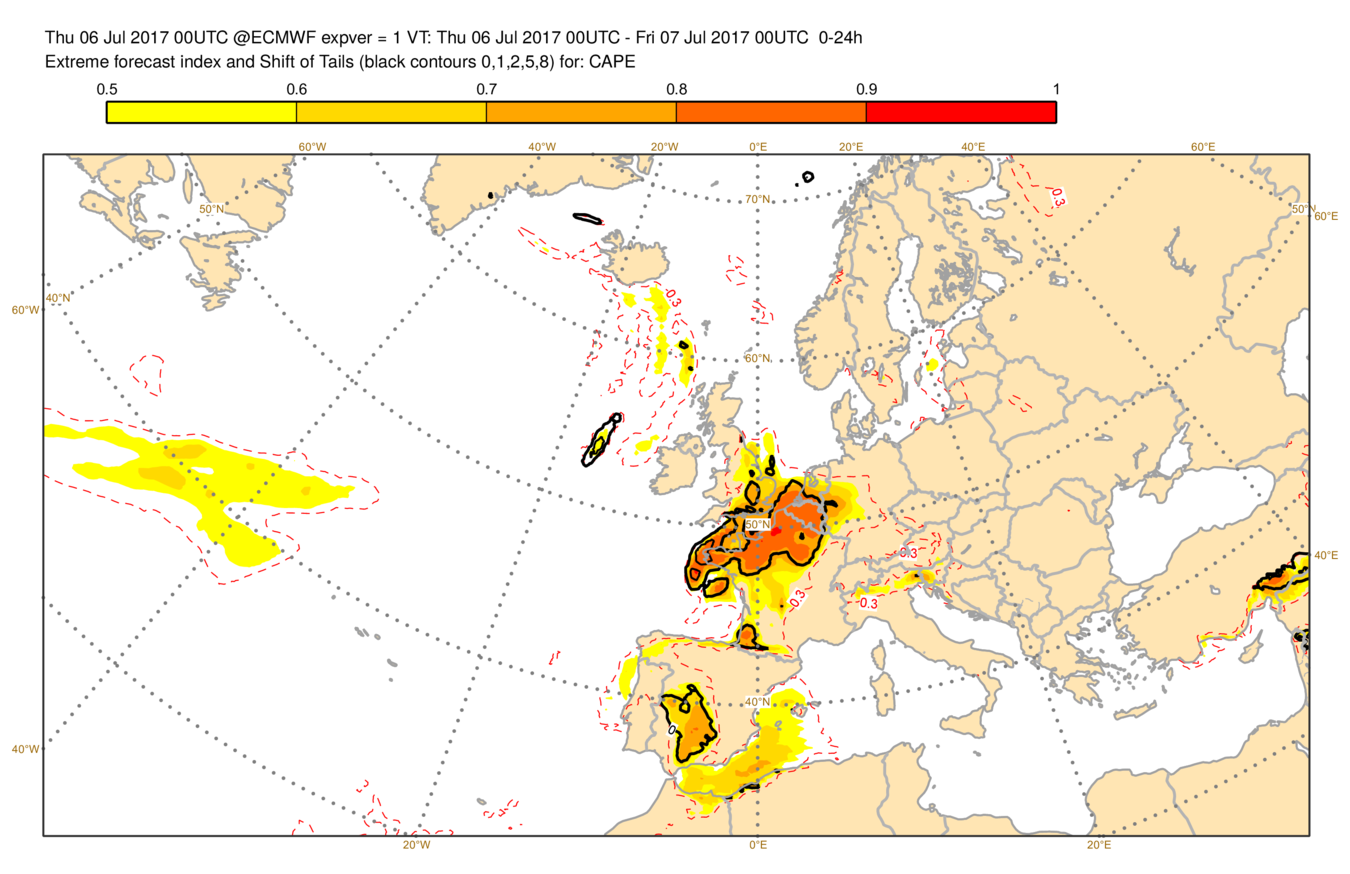
The calculation of EFI is based on the proportion of EPS members lying below the p quantile of the climate record derived from the model (M-climate). EFI is applied on a daily basis to the following variables: temperature, wind speed, wind gust, Convective Available Potential Energy (CAPE), snowfall and total precipitation.
If the forecast probability distribution agrees with the M-climate distribution then EFI = 0. If the probability distribution (mean, spread and asymmetry) does not agree with the climate probability distribution, the EFI takes non-zero values. In the special case where all the members forecast values above the absolute maximum in the M-climate, the EFI = +1; if they all forecast values below the absolute minimum in the M-climate the EFI = -1.
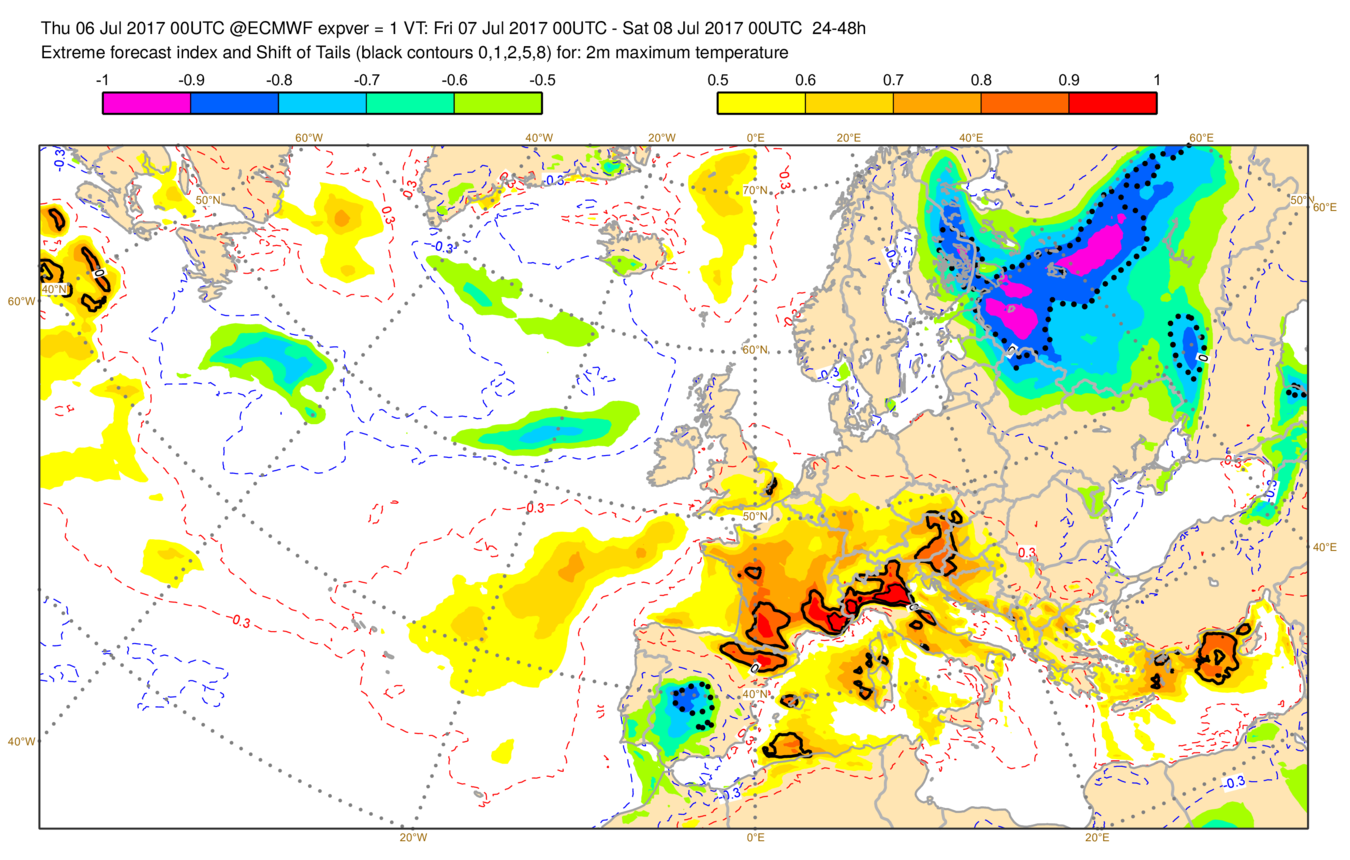
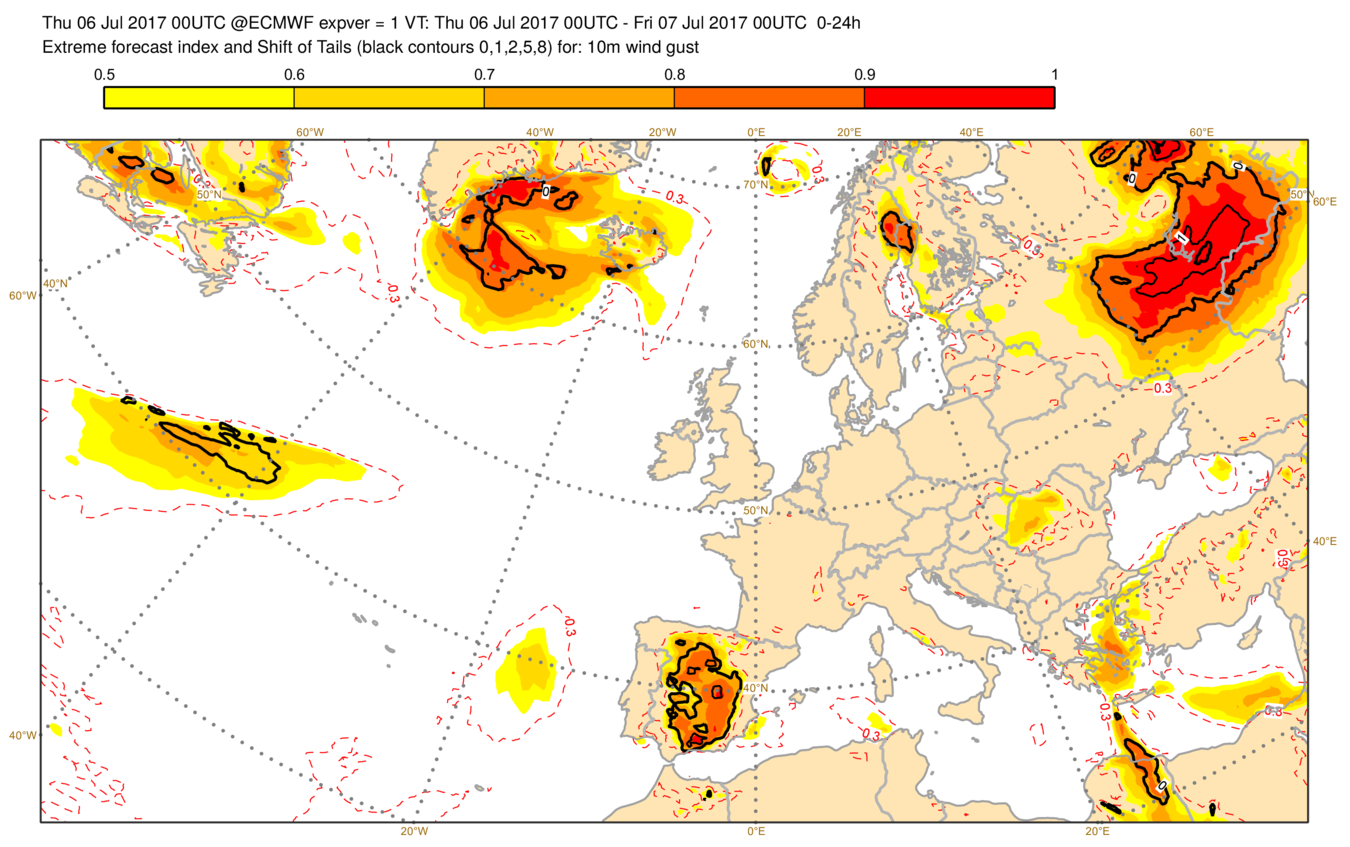
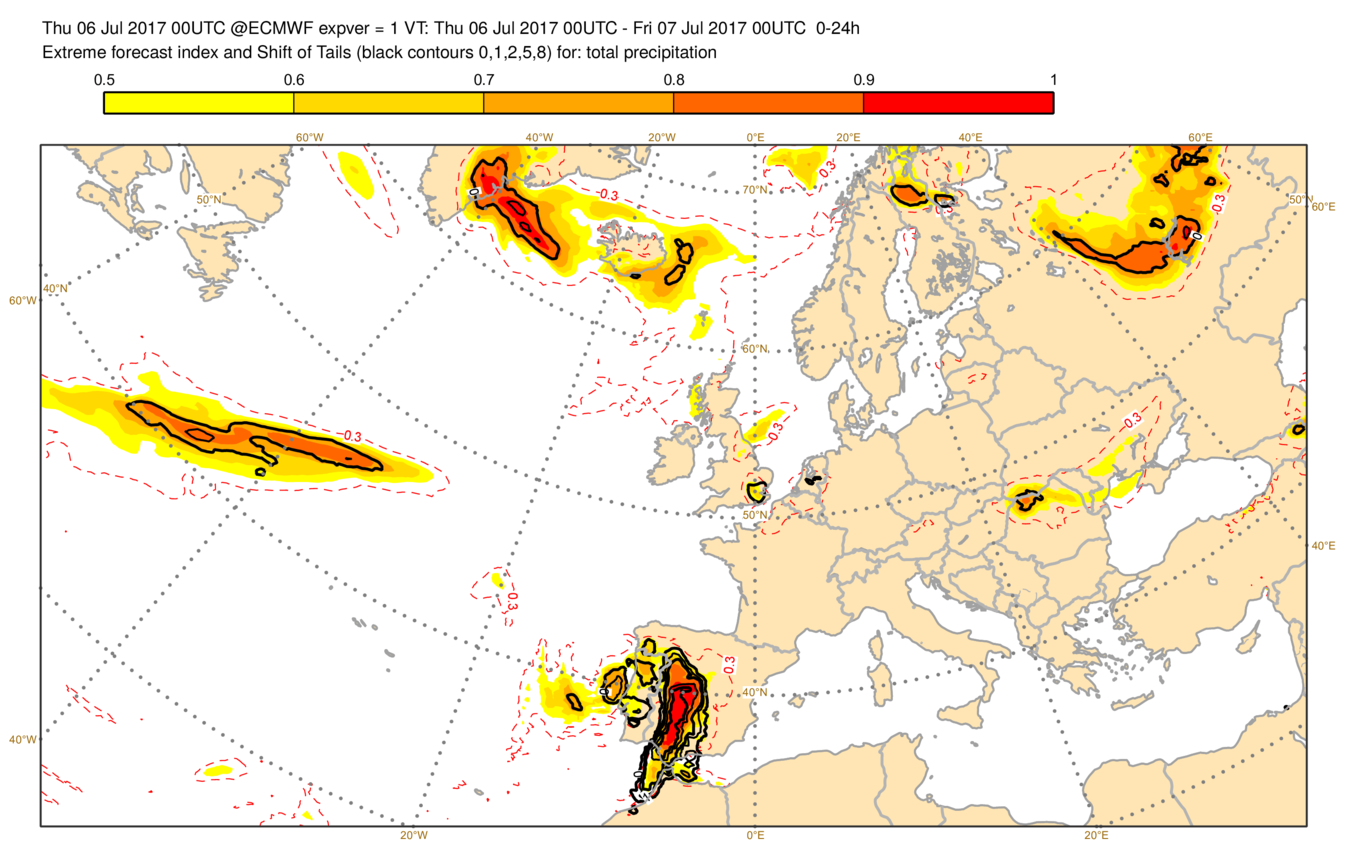
Experience suggests that EFI values of 0.5 – 0.8 (irrespective of sign) can be generally regarded as signifying that “unusual” weather is likely and values above 0.8 as usually signifying that “very unusual” or extreme weather is likely.
Although a high EFI value indicates that an extreme event is more likely than usual, the values do not represent a probability. Since potentially extreme situations (wind storms, for example) are characterized by high dynamical instability in the atmosphere and large spread, EFI users should be aware that it is not uncommon for an extreme event to be preceded by wide-ranging ensembles, yielding EFI values that are not particularly high. CDFs should be directly referenced. If, for example, the EFI indicates to forecasters that anomalous wind speeds or rainfall rates are more likely than normal, they have to find out from the CDF diagram what this means for a specific threshold, e.g. 5 mm/12 hours. If the climatological risk is 5% and the predicted probability is 20%, the risk is four times larger than normal. Any action will, however, depend on whether this 20% is high enough for a specific end-user to undertake protective action.


